2. Dashboard
The Dashboard is the first page you see after logging in. It gives you a high-level view of your entire automation platform: how many workflows are running, how healthy they are, recent failures, and which workflows are most active.
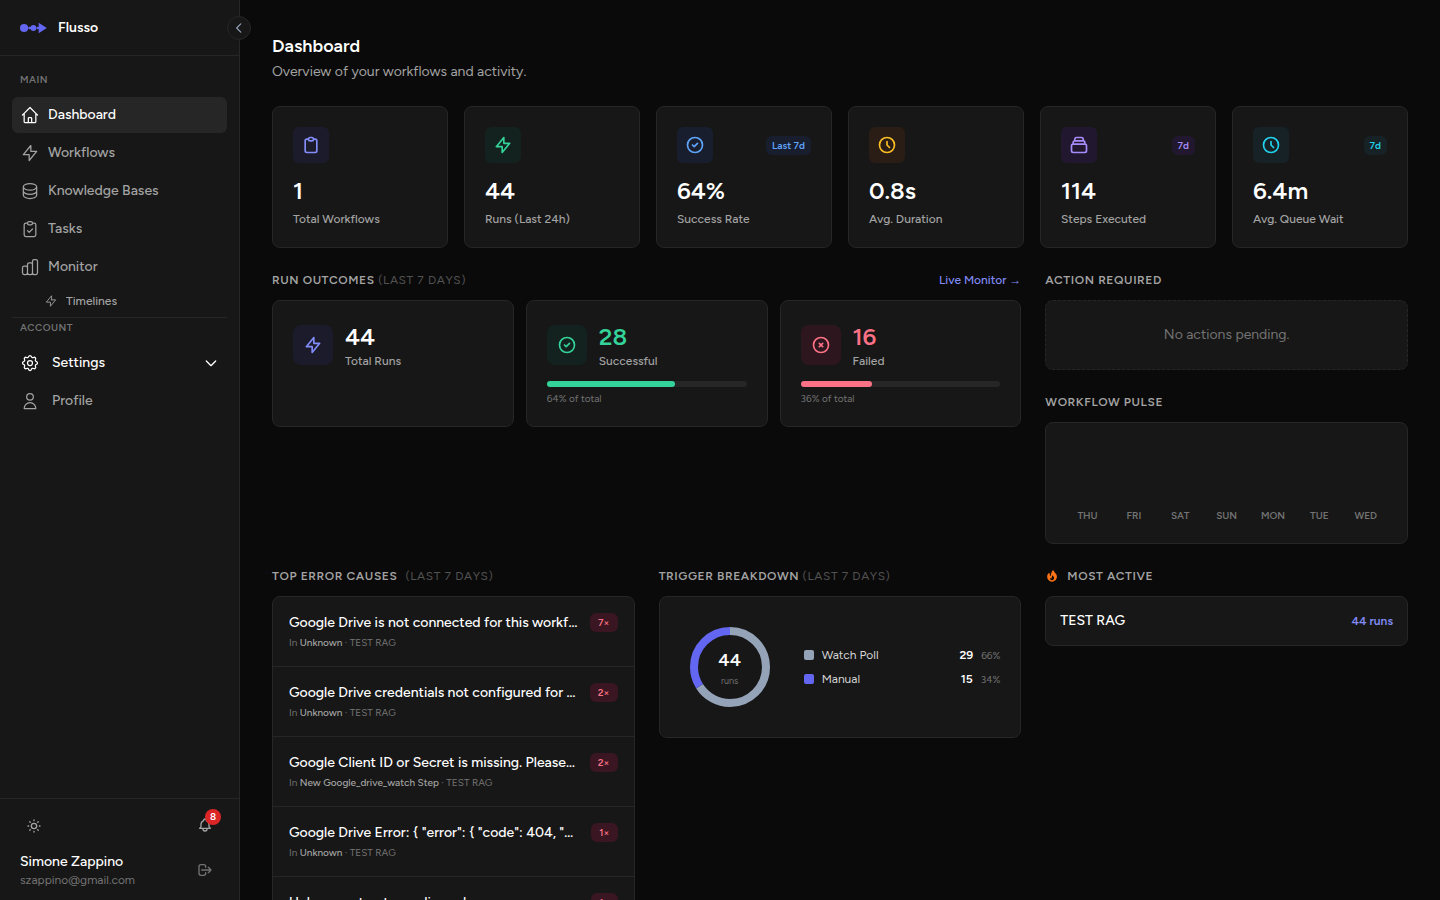
Metric Cards
The top row displays four summary statistics that update automatically to reflect the current state of your account.
| Metric | What it shows |
|---|---|
| Total Workflows | The total number of workflows in your account, regardless of status. |
| Active Runs (24 h) | How many workflow runs were started or are still running in the last 24 hours. |
| 7-Day Success Rate | The percentage of completed runs that succeeded (not failed) over the past seven days. A healthy value is 95 % or above. |
| Avg. Execution Time | The average wall-clock duration of all completed runs over the last seven days, expressed in seconds. |
Activity Pulse Chart
Below the metric cards, the activity pulse chart plots workflow run counts by day for the past seven days. Each bar represents a calendar day. Hover over a bar to see the exact counts for that day.
Use this chart to spot patterns: recurring spikes often correspond to scheduled workflows; unexpected dips may indicate a trigger or authentication issue.
Pending Actions
If any running workflow has reached an Approval or Manual Input step, a "Pending Actions" card appears on the dashboard showing how many items are waiting. Click View Tasks to go directly to the Tasks page and respond to those items.
Recent Errors
The Recent Errors panel lists the most recent failed runs across all your workflows. Each entry shows:
- Workflow name — the workflow that failed.
- Failed step — which node caused the failure.
- Error message — a short summary of the exception or error.
- Timestamp — when the failure occurred.
Click on any error entry to navigate directly to the run detail page where you can inspect the full execution trace, including the exact input and output of every step.
Hot Workflows
The Hot Workflows list ranks your workflows by execution frequency over the last seven days. The most frequently run workflow appears at the top. Use this to understand which automations drive the most activity in your account.
Stale Workflows
Stale Workflows are active workflows that have not executed in the last seven days. This often means a trigger is misconfigured, a schedule is incorrect, or the workflow was accidentally set to Draft. Review stale workflows regularly to ensure nothing critical has gone silent.
Trigger Type Breakdown
A small summary at the bottom of the dashboard shows how your workflows are distributed by trigger type (Manual, Webhook, Schedule, Event, Error). This helps you understand the composition of your automation stack at a glance.
Tips for Using the Dashboard
- Check the dashboard at the start of each day to catch any failures that occurred overnight in scheduled workflows.
- A sudden drop in the 7-day success rate is the first signal that something has broken — drill into Recent Errors to find the cause.
- If a workflow appears in Stale Workflows unexpectedly, verify its status is Active and that its trigger (especially cron expressions) is correctly configured.
- The Pending Actions card is the fastest way to ensure human-gated workflows do not stall critical business processes.