5. Workflow Monitor
The Workflow Monitor provides a real-time, unified view of all workflow executions across your entire account. Unlike the per-workflow run history, the Monitor shows every run from every workflow in one place, updating live as workflows execute.
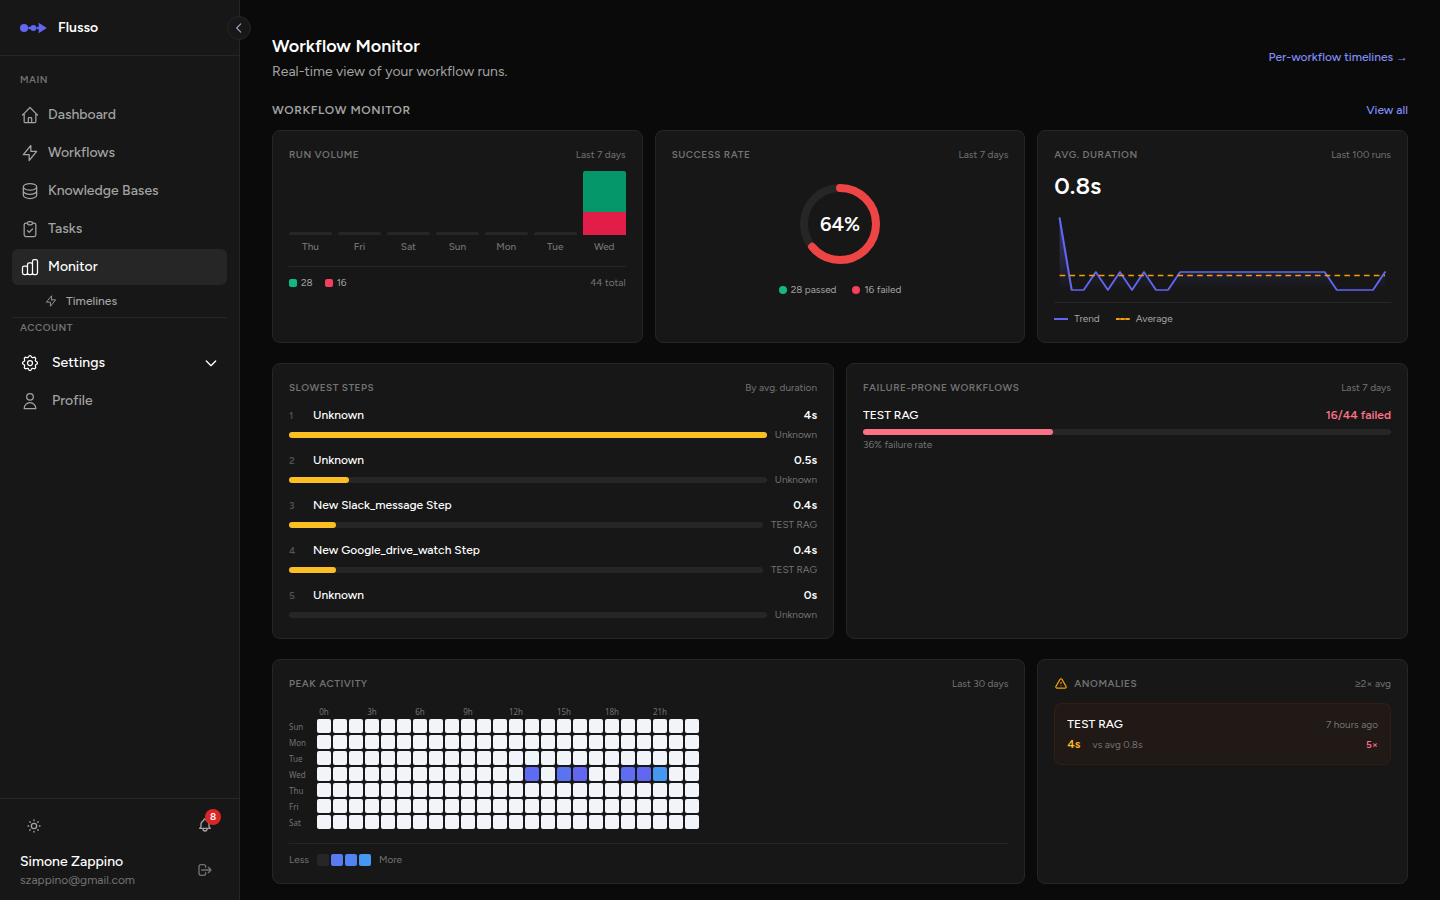
Run Cards
Each active or recent workflow run is displayed as a card. The card shows:
- Workflow name — the workflow this run belongs to.
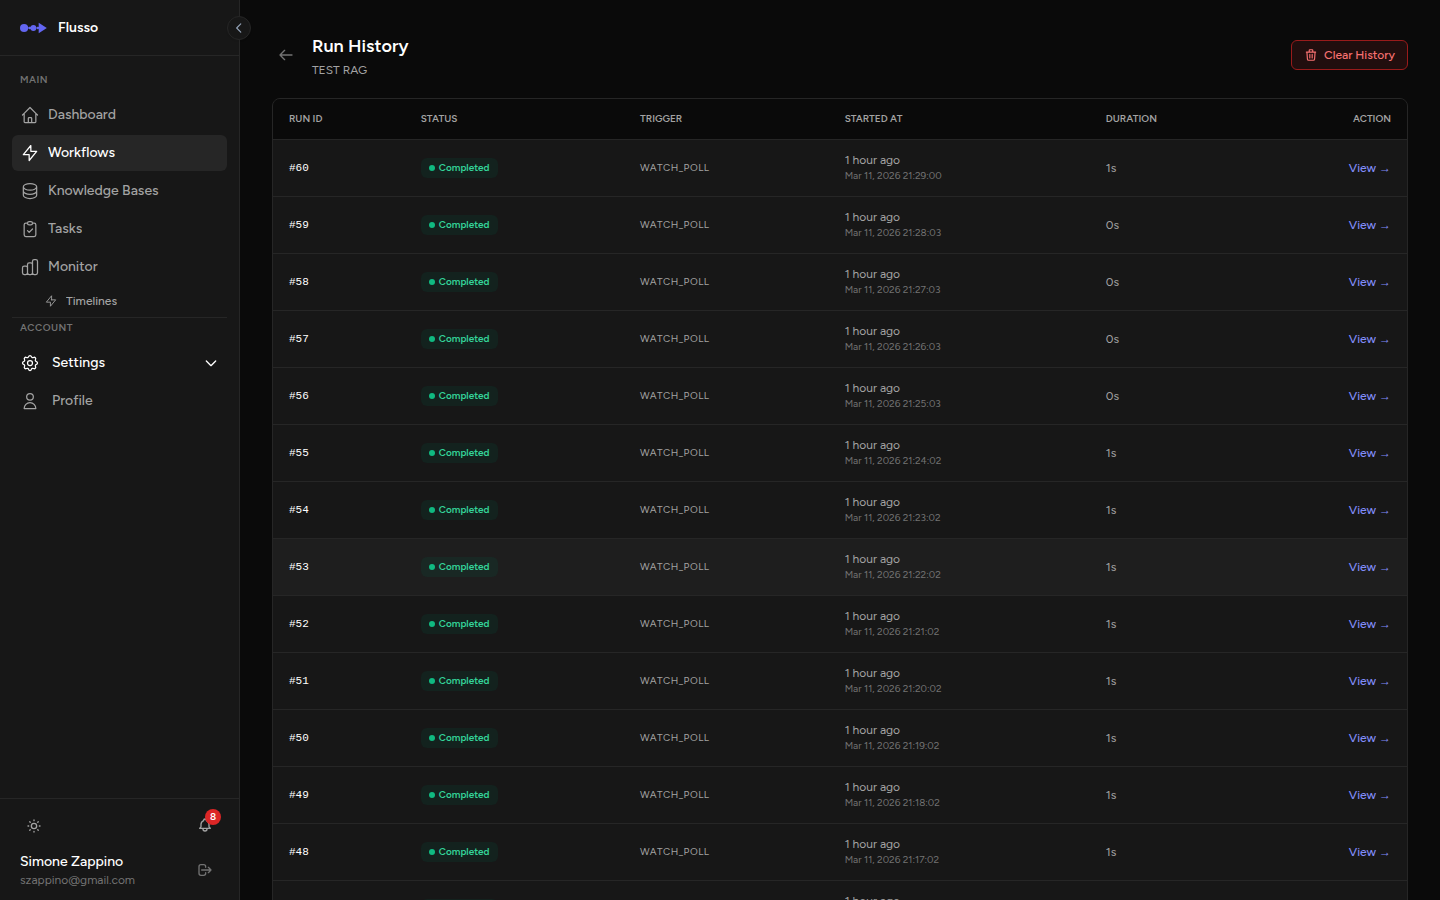
- Trigger type — how this run was started (Manual, Webhook, Schedule, etc.).
- Status badge — the current state of the run (Running, Completed, Failed, Waiting, Queued). The badge updates in real time.
- Started at — the timestamp when the run began.
- Duration — how long the run has been running (for active runs) or how long it took (for completed runs).
- View button — click to open the full run detail page.
Real-Time Updates
The Monitor page subscribes to live events from the server. You do not need to refresh the page — run cards appear, update, and change their status badges automatically as your workflows execute. This is powered by Flusso's built-in real-time event broadcasting.
New runs appear at the top of the list as soon as they are queued. Status changes (from Queued to Running, from Running to Completed or Failed) are reflected immediately on the card.
Searching & Filtering
Use the filter controls at the top of the Monitor page to narrow down the list:
- Search by workflow name — type to filter cards by the workflow's name.
- Filter by status — show only Running, Completed, Failed, Waiting, or Queued runs.
- Filter by trigger type — narrow down to webhook-triggered, scheduled, or manual runs.
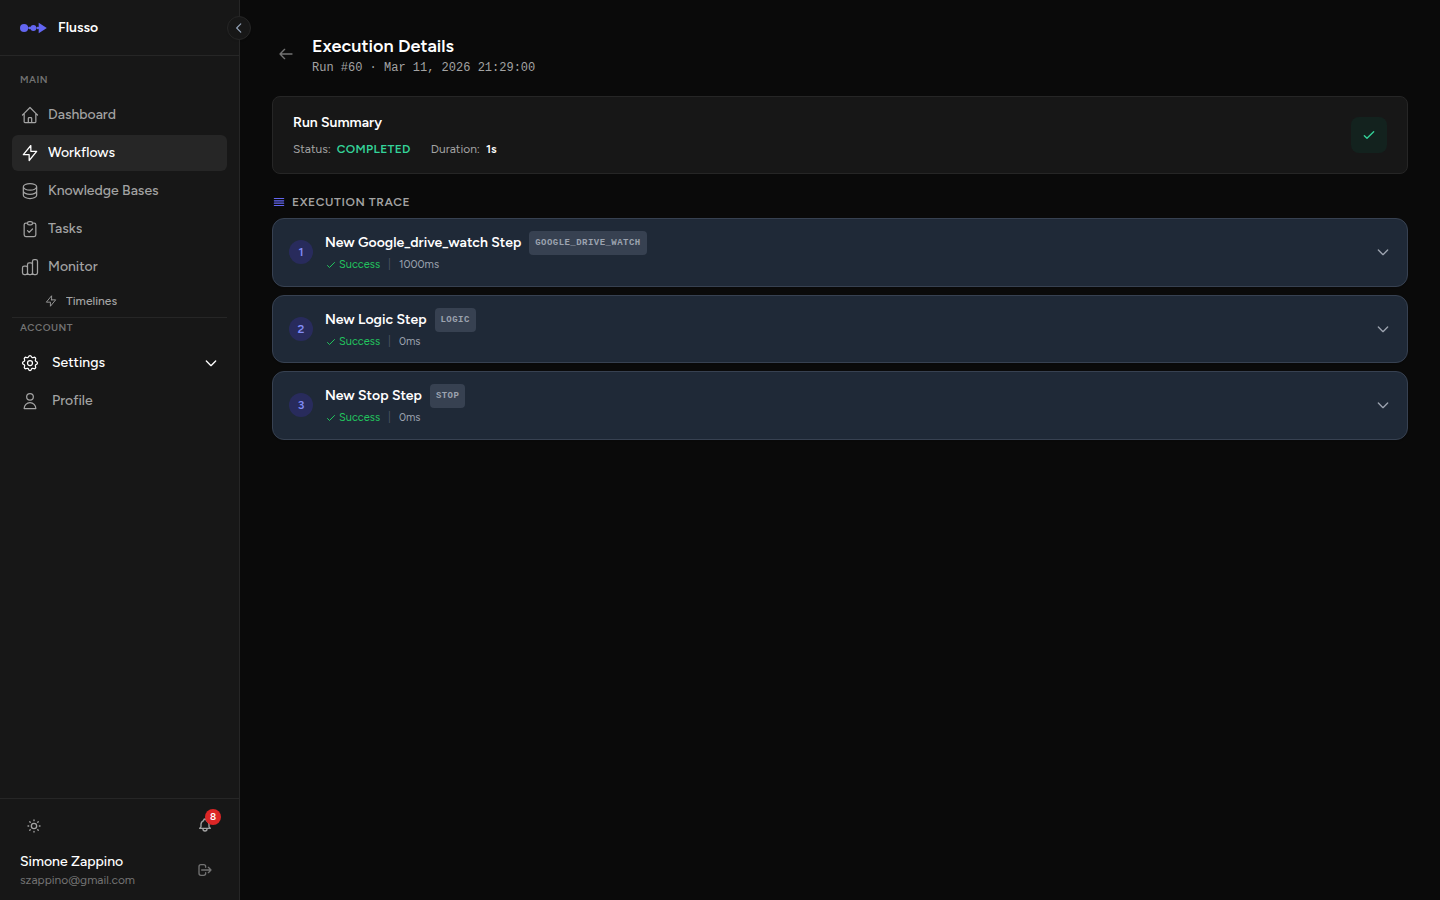
Viewing Run Details
Click the View button on any run card to open the run detail page. The detail page shows a complete step-by-step execution trace, including:
- Each step's name, type, and execution status.
- Start time, end time, and duration of each step.
- The full input data that was passed into the step.
- The full output data produced by the step.
- Any error message if the step failed.
- Parent–child relationships for loops and parallel branches.
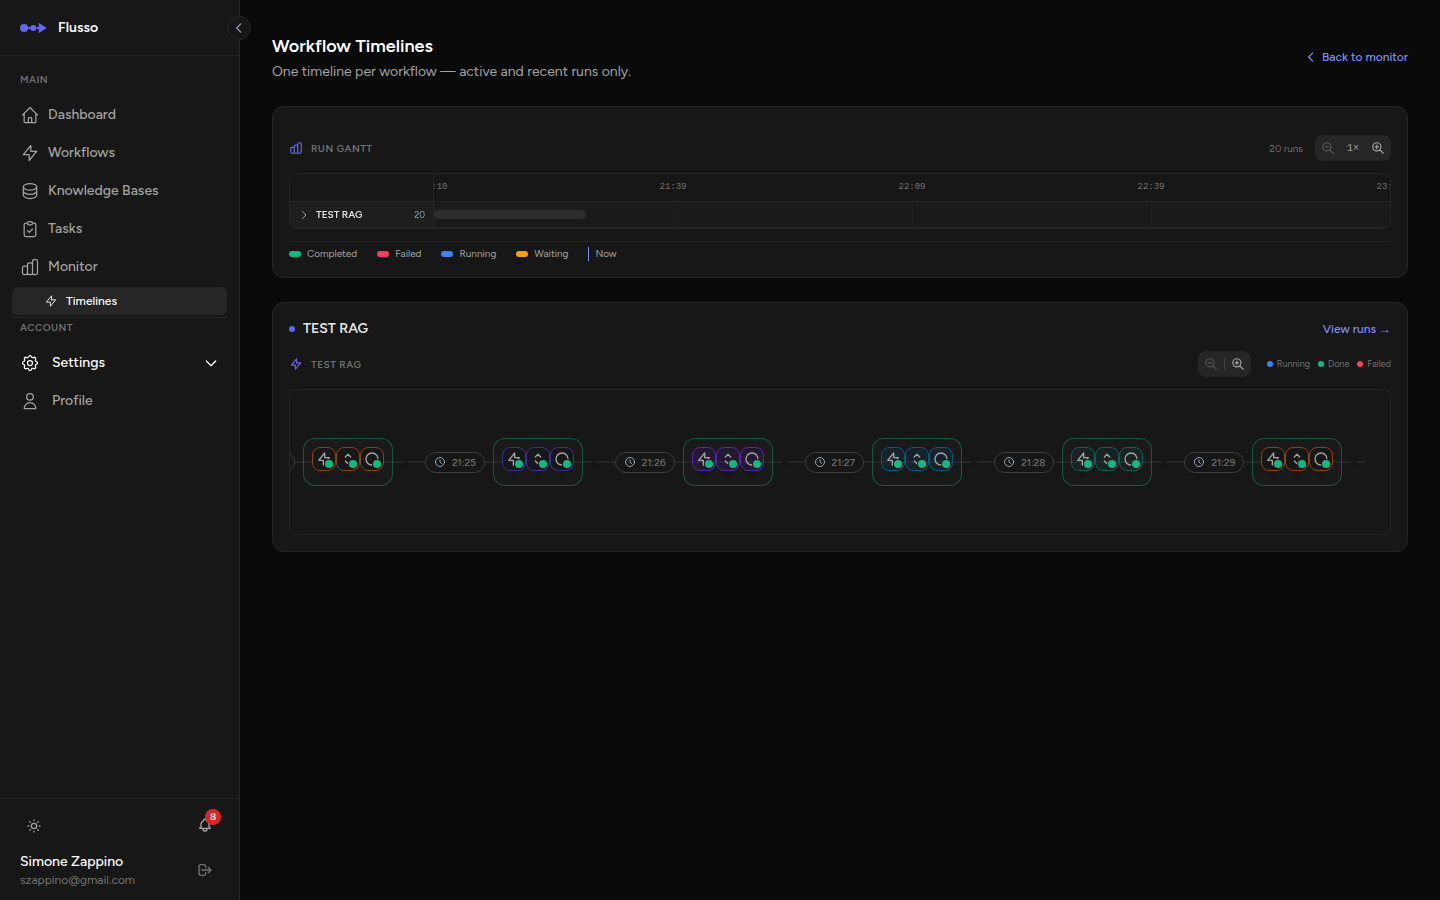
Timelines View
The Timelines page (accessible from the sidebar under Monitor) provides a complementary perspective: a Gantt-style timeline that shows when each step in a workflow run started and how long it ran.
The Timelines page is grouped by workflow. For each workflow, you can see the event stream from the last 24 hours or any currently active run. Each event includes:
- Step name and type.
- Start and end timestamps.
- A horizontal bar representing the duration relative to other steps.
- Error messages if a step failed.
Replaying Webhook Runs
When a workflow is triggered by a webhook, Flusso logs the incoming request (headers and body) to the Webhook Logs. If the workflow fails, you can replay the exact same request without needing the original caller to send it again.
To replay a webhook run:
-
Open the failed run detail From the Monitor or the workflow's run history, click the failed run.
-
Click "Replay" The Replay button appears at the top of the run detail page for webhook-triggered runs.
-
Monitor the new run A new run is created with the same payload. Watch it on the Monitor page.
Tips for Effective Monitoring
- Keep the Monitor page open in a browser tab during development to see your workflow executions live as you test.
- Use the Timelines view after a failed run to quickly identify which step was the slowest — slow steps often time out or exhaust token limits.
- The Monitor shows runs from all your workflows. If you have many workflows, use the workflow name search to focus on the one you are debugging.
- Replay failed webhook runs without coordinating with external systems — a major time saver when diagnosing integration issues.